How can your store use Textbook KPIs (Key Performance Indicators) to enhance your evaluation of its performance through rush as well as its management of faculty adoptions? MBS’ KPI tools provide easy analysis of key data, including Textbook KPIs. Let’s take a look at the reports that help supply transparency into key data figures as they relate to textbook management.
 In MBS’ Textbook KPI Dashboard, stores can easily assess how their textbook department is performing and quickly identify areas that might need more attention. It is a great tool to use both pre- and post-rush. Let’s take a look at the information available in the quick-access Textbook KPI.
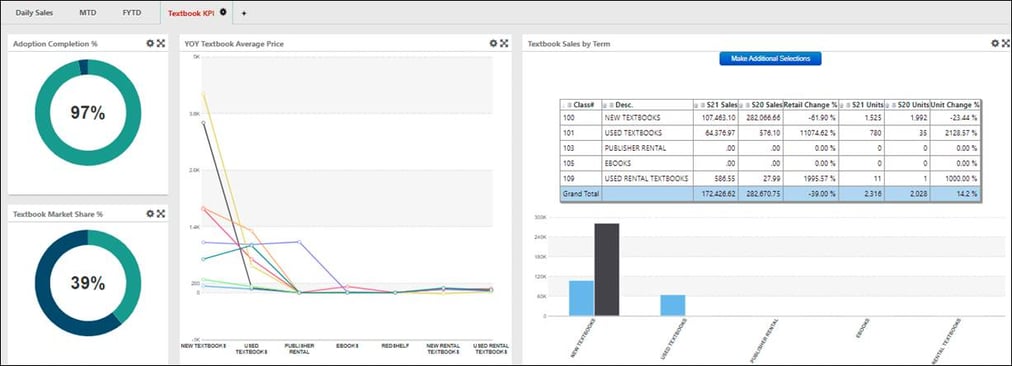
Adoption Completion Rate – This chart displays your current adoption rate to help you keep track of how many outstanding adoptions your store has.
Textbook Market Share Rate – Here, you can view your store’s ratio of estimated sales to estimated enrollment. This gives you your percentage of market share. By clicking on the bar, you can get a detailed view displaying publisher performance (including retail prices, actual enrollment, sales quantity, and sell through % for each book sold by vendor, based on selected date range, term, and/or specific ISBN) as well as generate and export the table.
Year-over-year Average Textbook Price – How does your store’s pricing this year compare to previous years? This line graph makes it simple to see how your pricing compares to other years. Each point shows the average price for that year. This can help you quickly evaluate student costs and report how it has changed.
Textbook Sales by Term – Compare the sales and units sold for the current term against the term in the previous year. These bar chart comparisons display your percentage of retail change. Easily make additional selections for a more detailed comparison and/or choose to subtotal by class.
Our business analytic tools are designed to fit into your daily workflow, providing immediate access to actionable business intelligence. You can analyze your store’s performance and quickly pinpoint opportunities to improve your store’s success. Contact your MBS system representative for more information about the reporting and analysis capabilities available.