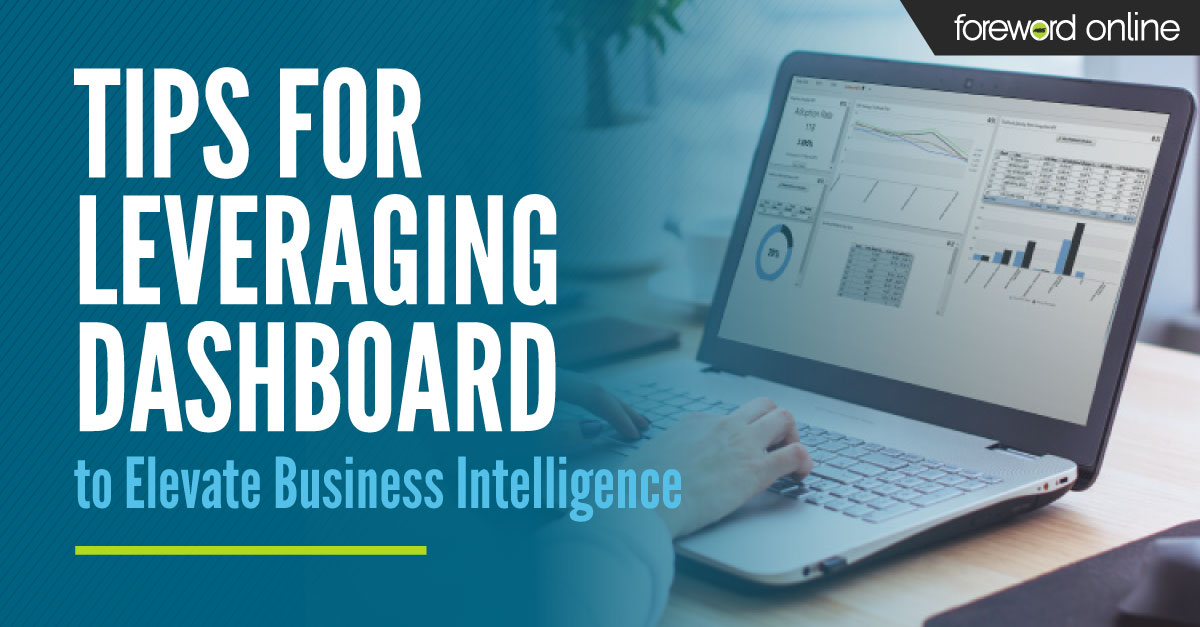
MBS Dashboard is an innovative business intelligence tool that helps college stores analyze and share their business successes. Through Dashboard, stores have access to reports, graphs, and other visuals with drill-down and filtering capabilities that make it easy to review, analyze and share the metrics that matter most to your store.

Dashboard has the power to use your store’s data to build unique and customized reflections of that information. From standard reports and KPIs to custom reports, the encompassing tool can provide a complete picture of your store.
We have put together some simple tips to help your store leverage MBS Dashboard to elevate your business intelligence.

Key Performance Indicators (KPI) Dashboard

MTD Revenue

Fiscal YTD Revenue
- Set goals and analyze progress with KPI metrics
KPI (Key Performance Indicators) metrics are a great way to show how your store operates. Covering Daily Sales, Month to Date, Fiscal Year to Date and Textbooks, you have access to the important comparisons you need to evaluate your current month against previous months or years. You can pinpoint the areas where your store is positively performing as well as areas that might need additional attention or troubleshooting. Through the KPI Dashboard, you have the flexibility to filter information in a way that is most useful for your specific store. This makes it simple to set measurable goals and track your progress toward them. - Get the most out of your data
Explore the depth of information available through Dashboard with clickable charts, tables and information. Analyze sales productivity by the hour, view your non-merchandise totals and tender totals, see your sell-through by vendor, division, size, color, etc., analyze your store revenue on a deeper, more specific level, and so much more. Set aside time to look at the scope of business intelligence information available to you to help you make vital store decisions. - Customize your information
With Dashboard, you can remove or replace reports on an existing tab (existing tabs are Daily Sales, Month to Date, Fiscal Year to Date and Textbook KPI) or create a new KPI tab and add in the specific report tiles that you would like to additionally view. The reports that are most essential to your business can easily be displayed, making it simple to check your data each day. - Share important information with administrators in an easy-to-digest, visual format
Dashboard makes it easy to send reports, charts and information to your administrators in a way that is easy to understand and quickly digest. This information can help you keep administrators informed and support your store’s goals when presenting new ideas or proposing changes. - Utilize custom reports
Dashboard pulls all data that flows into Arc, including everything from the POS and inSite (eCommerce). If there is a report you need that you don’t currently have, you can work with us to design and create the report to meet your needs.
If you would like more specific information about using Dashboard, watch the 2021 Leveraging Dashboard to Elevate Business Intelligence webinar. If you would like more information about getting Dashboard, please contact your systems sales consultant.


